
This setup will be done stricly with Security Onion – it’s relatively straightforward and simple, it combines well known security tools, such as
- Zeek
- Wazuh
- Suricata
- Osquery
- ElasticSearch
- Cyberchef
- Kibana
Furthermore, this can get exponentialy more complex depending on the amount of hosts, nodes, size and scope of your network.
Like always, I like making it simpified and straightfoward, because once you can simplify something, YOU become an expert.
Hardware/software requirements:
- A managed switch that you can use to mirror the UPLINK (meaning, if the traffic from the router goes to port 1, mirror this port so it captures all traffic on the network. I have a recommendation on my home network blog here
- A host that can stay up, so you can use a mini computer, a server, your own computer – whichever you can keep up constantly to record the traffic. (it will require 2 NICS, one for management, one for sniffing – so for example, WIFI and ethernet, or a USB nic)
- The host, for testing purposes, can run on 100 GB storage, 2/4 CPU cores, 6-12 GB ram minimum. Of course, Security Onion will say it requires double or more, but it will run regardless – especially on a home network with just a few devices, expect performance to be not so good, and storage time to be less than a week.
- Vmware or Virtuabox
- OR a dedicated A mini computer!
I will show how to do this on your computer first, and then describe the process on a separate dedicated device.
On your own computer, install VMWARE Workstation PRO – if you don’t have a key, google it.
Secondly, download the security onion ISO, google it.
Once you have VMware and the ISO ready to go, load it into a new machine in VMware.
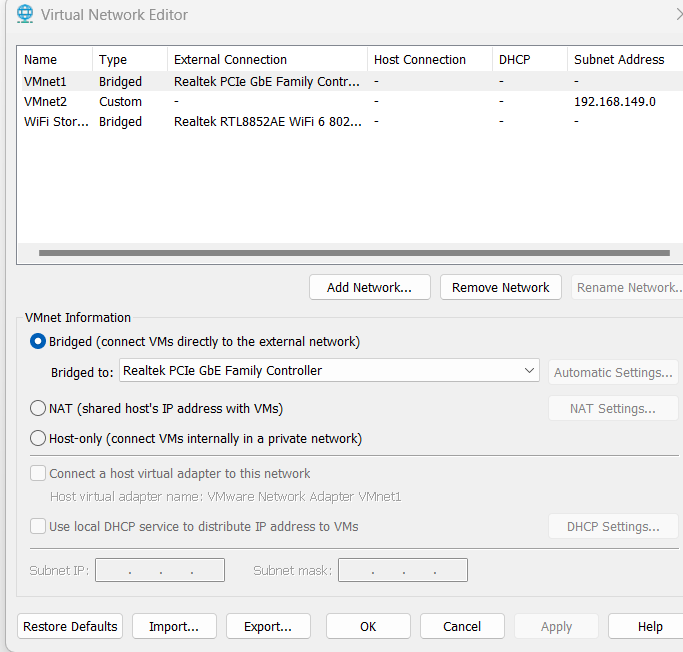
To make it easy, I’ll simpify the NIC setup in VMware. Let’s say you have 2 ethernet connections (1 is a mirrored port, the other is regular), the mirror connection goes to your RJ45 connection in your laptop, the regular connection goes to a USB NIC (adapter). Now, you should see both interfaces in your computer and you can name them appropriately.
Go into VMware, and edit the Virtual Network Editor, then connect the mirrored interface to vmnet0 and the USB interfvace to vmnet1.
Now, even easier, there are 2 references I can provide to complete the Security Onion setup. But I have included answers to the hardest parts of the setup right after.
https://docs.securityonion.net/en/2.3/first-time-users.html
Should I setup NTP servers? How?
 - yes, this will allow the logs to be the correct timezone. Google ntp servers, such as https://www.pool.ntp.org/zone/ca

Which NIC should be management?
- The one that is regular connection, not the mirrored one.

Should Security Onion appliance have access to the internet?
- No, you can set it up as air gapped. It does not need access so far.

Should I do a static IP for the web GUI?
- Absolutely, one that is within your private network so you can always access it.

Why don't I have access to the web interface?
- This is typically due to the allowed subnet to be incorrectly configured (ex, 192.168.0.1/24 instead of 192.168.0.0/24). Or you have not run so-allow command and allowed the Analyst (you) to have access.

What email should I set up for the user?
- I just do <<name>>@local.com

How long are the logs kept for?
- 30 days, but also depends on the amount of storage you have ~ total events. (I can show how to change this later)

Should I do an airgap install?
- My recommendation is do not, as airgap then requires you to mount an ISO each time an upgrade comes out, with internet connection, it will automatically update the rules when required, or the SO version.
NICE! Now you should be able to see Security Onion right? It should look awesome, you set it up yourself and have visiblity over your entire network with a variety of excellent SECURITY tools all in ONE package!
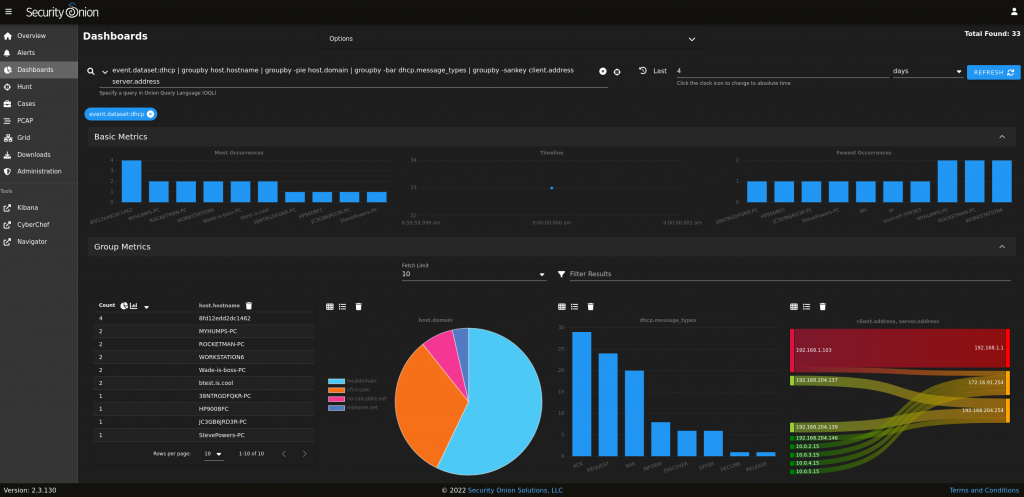
Now let’s make sure it’s actually working – to do so you need to go into Dashboards and scroll down to Events, we want to see that the most recent events are being logged.
Here, go ahead and filter out “security onion” as the host by selecting exclude. Then filter out by excluding the gateway (192.168.0.1, for example) – from here just browse any regular site or just monitor the traffic by clicking refresh.
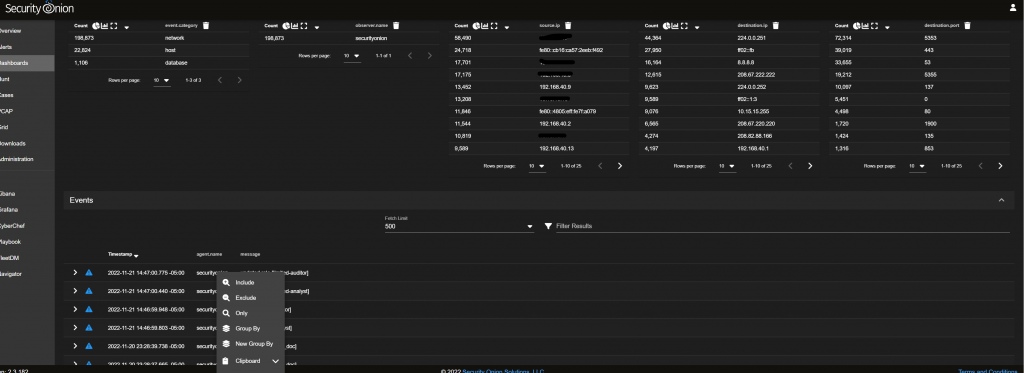
You should see familiar traffic and events being logged in your network.
Set up a dedicated device (mini computer)
This part is generally pretty easy, and would improve performance as you will use the entire capacity of the device you use. Simply put, the entire installation will be the exact same, but you will boot directly from the appliance, or in the case, the mini computer. To learn how to boot from an ISO + USB, please review the blog here.
Only thing to note is that once you boot from the USB, it will delete any other OS on the system and all partitions, so be careful!
SSH Hardening
To ensure we secure remote access to our Security Onion instance, run sudo so-ssh-harden, this will update the encryption key. Also, open up the SSH config, “vi /etc/ssh/sshd_config” and update the settings per your SSH hardening needs (rhost, maxauthattempts, x11)
Investigating an Alert from start to finish.
Once you know all events are logged, head over to “alerts”, you should already see a few alerts being logged (99.99% false positives). To get a taste of how the platform operates, go ahead and click the “escalate” button beside the alert. In my case, I investigated
| GPL ICMP_INFO PING *NIX |
The above alert is pretty much useless, hey, someone may be pinging your NETWORK!? Let’s find out more.
This will take you to “Cases”, Cases interface gives you an incident response platform that tightly integrates with Hunt and Alerts. For any SOC analyts, this is going to be pretty jaw dropping, you just created a SOC in your own enviornment. Congrats!
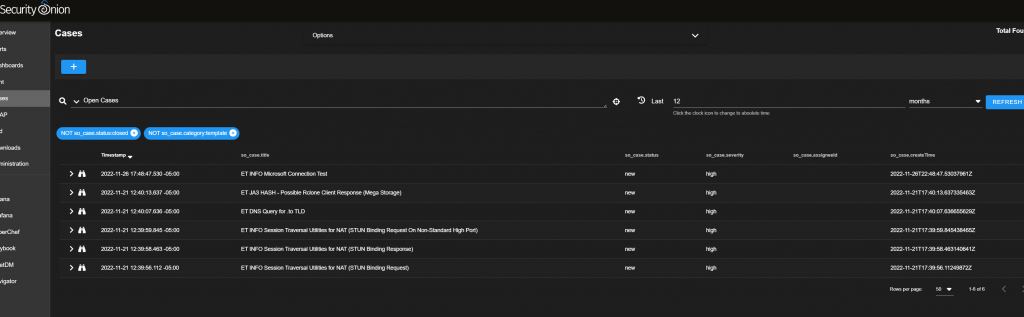
Once you are there you want to head over to “Events” tab inside of the case, and hunt beside the “Rule.name:”
The Hunt interface is purpose built to let you investigate events quickly and easily. Here, click on the down arrow beside each event to get a breakdown of what happened. Looking closer at the metadata, we can see the source, destination, message, and even rule:
alert icmp $EXTERNAL_NET any -> $HOME_NET any (msg:"GPL ICMP_INFO PING *NIX"; itype:8; content:"|10 11 12 13 14 15 16 17 18 19 1A 1B 1C 1D 1E 1F|"; depth:32; classtype:misc-activity; sid:2100366; rev:8; metadata:created_at 2010_09_23, updated_at 2010_09_23;)Reviewing the rule, it fires if any ICMP traffic is observed from external_net to home_net, in my case it was a device within my network in the same VLAN to the gateway. Let’s examine why this rule fired since EXTERNAL_NET should filter out devices inside of my network.
RULE TUNING
If you want to do rule tuning in Security Onion – research SALT first, then BPF
I know this is a Suricata rule, so I found that by default, EXTERNAL_NET is set to any (which includes HOME_NET) to detect lateral movement inside your environment. You can configure the variable here. For now, I leave as is, and would prefer to disable the rule itself as i’m not interested in such traffic.
To remove from the GUI, acknowledge the rule back in the GUI in the Alerts tab, that means the alert will still fire but will not show up in the Alerts page until you filter out the “acknowledged rules”
Otherwise, you can go ahead and disable the rule by the SID or rule.uuid “2100366”.

Then verify it’s disabled (commented out) by typing the following command:
grep 2100366 /opt/so/rules/nids/all.rulesUsually, this will take some time to take affect in your environment. To do more specific granular rule tuning, or in bulk – check out this video here: https://www.youtube.com/watch?v=1jEkFIEUCuI&ab_channel=SecurityOnion
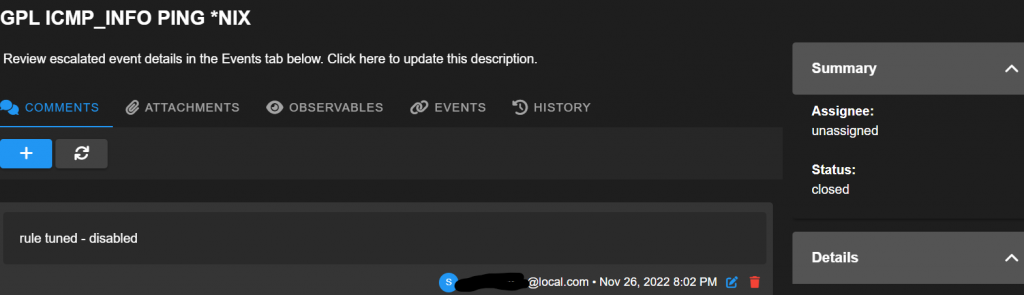
Perfect! Now let’s go back to the GUI and we will close the case. In the case, add comment “rule tuned – disabled” and close it.
Log Retention
The minimum hardware requirements that Security Onion recommends is 200GB. If we are discussing a standalone manager- there is a great thread on what you will need here: https://groups.google.com/g/security-onion/c/IA0VPFNSqew
To summarize, I provided mine with 400GB and I have about 10-15 devices on the network, only 2 users, work from home. I am a medium – heavy user, let’s call it 5-10 gig download per day and I expect my logs to be kept for about 2-3 weeks.
Your options for setting this up is 1. At the installation menu, choose the true nature of how much GB you have available. 2. You can always expand your VM storage later. 3. Changing the stenographer and indices (log.size) in the manager.
Generally, it should work like this:
- set
log_size_limitfor your desired retention in Elasticsearch (this is found in SALT minion). Usually this defaults to about half of your total GB. - Stenographer will then use the remaining space until disk free space reaches 10% and it will then start purging the oldest packet capture data
Stenographer is used to capture PCAP, so this obviously requires more data more quickly. You can change this setting via adding diskfreepercentage under steno in the SALT minion.
The user guide is available here under Data Retention: https://docs.securityonion.net/en/2.3/post-installation.html
Comments are closed